Practical Operation Guide
This guide provides manual for Kurator pipelines, detailing steps for applying predefined and custom tasks, exposing services, configuring GitHub webhooks, and monitoring pipeline execution, aimed at efficient and effective pipeline management in Kubernetes environments.
Applying Pipeline Examples
This section demonstrate the practical operation of Kurator pipelines, highlighting two key examples: one with a predefined task and another with a custom task. These examples provide insights into the functionality and adaptability of Kurator pipelines in different scenarios.
Creating a Namespace
The first step involves creating a dedicated namespace in Kubernetes.
kubectl create ns kurator-pipeline
This namespace will be used for all subsequent resource deployments related to our pipeline examples.
Applying a Pipeline with Predefined Task
echo 'apiVersion: pipeline.kurator.dev/v1alpha1
kind: Pipeline
metadata:
  name: test-predefined-task
  namespace: kurator-pipeline
spec:
  description: "this is a test-predefined-task, it shows how to use predefinedTask."
  tasks:
    - name: git-clone
      predefinedTask:
        name: git-clone
        params:
          git-secret-name: git-credentials
    - name: go-test
      predefinedTask:
        name: go-test
        params:
          packages: ./...'| kubectl apply -f -
In this example, we illustrate how to apply a pipeline that incorporates a predefined task.
This setup includes a git-clone task, which is a common initial step in many pipelines, followed by a predefined go-test task.
This combination effectively demonstrates the utility and ease of using predefined tasks in a Kurator pipeline.
Applying a Pipeline with Custom Task
echo 'apiVersion: pipeline.kurator.dev/v1alpha1
kind: Pipeline
metadata:
  name: test-custom-task
  namespace: kurator-pipeline
spec:
  description: "this is a test-custom-task, it shows how to use customTask."
  tasks:
    - name: git-clone
      predefinedTask:
        name: git-clone
        params:
          git-secret-name: git-credentials
    - name: cat-readme
      customTask:
        image: zshusers/zsh:4.3.15
        command:
          - /bin/sh
          - -c
        args:
          - "cat $(workspaces.source.path)/README.md"' | kubectl apply -f -
This example shows the config of a pipeline with a custom task.
It begins with the same git-clone task as in the previous example.
Then, it introduces a custom task designed to display the contents of the README file from the cloned repository.
This example shows the flexibility of Kurator pipelines, allowing users to tailor tasks to their specific needs.
Viewing Event Listener Services
After successfully creating the above resources, users can view the automatically generated services and corresponding pods in Kubernetes.
$ kubectl get svc -n kurator-pipeline && kubectl get po -n kurator-pipeline
NAME                               TYPE        CLUSTER-IP      EXTERNAL-IP   PORT(S)             AGE
el-test-custom-task-listener       ClusterIP   10.96.11.110    <none>        8080/TCP,9000/TCP   93s
el-test-predefined-task-listener   ClusterIP   10.96.116.217   <none>        8080/TCP,9000/TCP   98s
NAME                                               READY   STATUS    RESTARTS   AGE
el-test-custom-task-listener-585f8b749b-qkv9j      1/1     Running   0          93s
el-test-predefined-task-listener-7d5774d7c-82whm   1/1     Running   0          98s
Exposing Services and Webhook Settings
Within the Kubernetes cluster, both el-test-custom-task-listener and el-test-predefined-task-listener are configured as ClusterIP services,
meaning they are only accessible internally.
To enable external systems, like webhooks, to access these services, we need to expose them outside the cluster.
For demonstration and testing convenience, a straightforward method for this is by using the kubectl port-forward command,
which allows us to forward a port from an internal service to a local server or computer.
Exposing Services
For demonstration and testing convenience, it’s necessary to open separate windows for exposing each service.
To expose the el-test-custom-task-listener service, execute the following command in a new window:
kubectl port-forward --address 0.0.0.0 service/el-test-custom-task-listener 30000:8080 -n kurator-pipeline
Similarly, for the el-test-predefined-task-listener service, use another window to execute this command:
kubectl port-forward --address 0.0.0.0 service/el-test-predefined-task-listener 30001:8080 -n kurator-pipeline
Setting up Webhooks for Pipeline
The pipeline events here are triggered via GitHub webhooks. This means that once the webhooks are configured to trigger on certain events, like code merges, the tasks described in the pipeline will automatically execute in sequence.
To set up webhooks for the pipeline, select the GitHub repository you want to associate with the pipeline.
For guidance on creating the webhook,
refer to the official GitHub documentation at Creating Webhooks.
In our example, the Payload URL should be set to your cluster’s external address plus port numbers 30000 and 30001,
and the trigger event selected as “Just the push event.”
Once the webhook is set up, you will see the status in GitHub page like the following indicating that the webhook is properly configured.
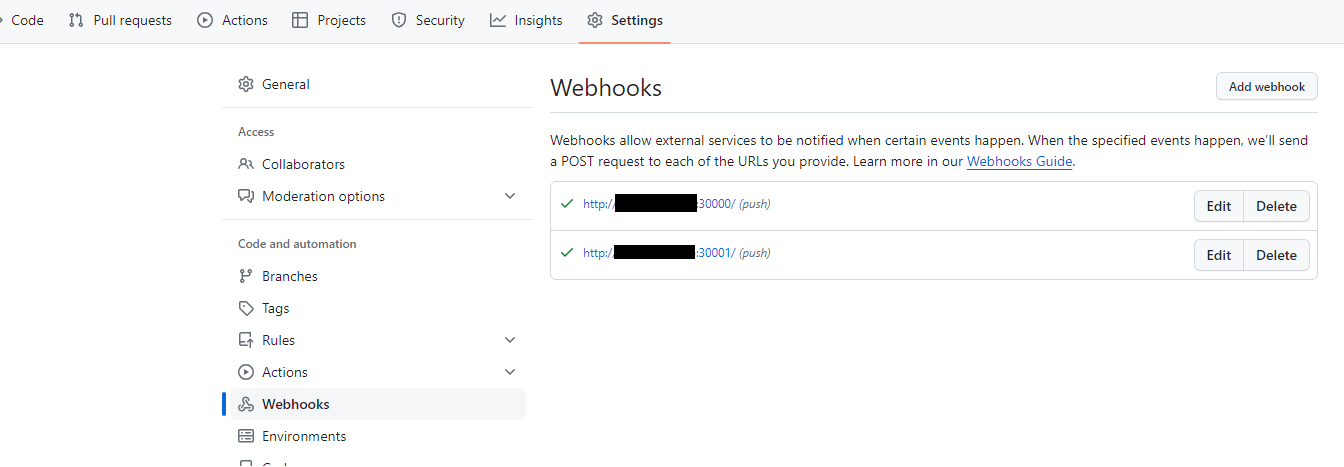
After setting up webhooks, it’s need to note that users may initially see a red exclamation mark instead of a green check mark. Once a webhook is successfully triggered for the first time, the icon will change to a green check mark, indicating that everything is functioning correctly.
Triggering the Pipeline
Trigger the Github Event
To trigger the pipeline, you might try pushing some content to the repository, such as a modification to the README. Information about the received event can be observed in the window where the forward service is running.
Forwarding from 0.0.0.0:30001 -> 8080
Handling connection for 30001
After the pipeline is triggered, the system will create individual pods for each task in the pipeline, executing them in order. You can view the current task execution status with a specific command.
$ kubectl get pod -n kurator-pipeline | grep task-run
test-custom-task-run-dgx8d-cat-readme-pod          0/1     Completed   0          31m
test-custom-task-run-dgx8d-git-clone-pod           0/1     Completed   0          31m
test-predefined-task-run-ffzbd-git-clone-pod       0/1     Completed   0          31m
test-predefined-task-run-ffzbd-go-test-pod         0/1     Completed   0          31m
View the Results of the Pipeline Execution
The actual execution details of each task can be viewed in the corresponding pods. Besides the more cumbersome method of checking each one individually, Kurator’s CLI provides a very convenient way to view the execution status of a pipeline, which user can directly list all the pipeline execution and access all task execution logs with a specific command.
You can view the execution instance of the currently triggered pipeline using the following command.
Note: You need to specify the kubeconfig file to use via the --kubeconfig flag in the command line, even if you are running the Kurator Pipeline in a single cluster environment.
$ kurator pipeline execution list  -n kurator-pipeline  --kubeconfig /root/.kube/kurator-host.config
------------------------------------- Pipeline Execution -----------------------------
  Execution Name          |   Creation Time     |   Namespace      | Creator Pipeline
--------------------------------------------------------------------------------------
test-custom-task-run-dgx8d | 2024-01-10 15:15:05  | kurator-pipeline | test-custom-task
test-predefined-task-run-ffzbd | 2024-01-10 15:15:05  | kurator-pipeline | test-predefined-task
After obtaining the Execution Name, you can directly retrieve the execution logs for all tasks using the following method:
$ kurator pipeline execution logs test-custom-task-run-dgx8d -n kurator-pipeline --tail 10 --kubeconfig /root/.kube/kurator-host.configINFO[2024-01-10 15:55:34] Fetching logs for TaskRun: test-custom-task-run-dgx8d-git-clone
INFO[2024-01-10 15:55:34] Fetching logs for container 'step-clone' in Pod 'test-custom-task-run-dgx8d-git-clone-pod'
INFO[2024-01-10 15:55:34] Logs from container 'step-clone':
+ cd /workspace/source/
+ git rev-parse HEAD
+ RESULT_SHA=92124ceb9b2aa84e5d256f8fe2d4968ecaa93758
+ EXIT_CODE=0
+ '[' 0 '!=' 0 ]
+ git log -1 '--pretty=%ct'
+ RESULT_COMMITTER_DATE=1704870903
+ printf '%s' 1704870903
+ printf '%s' 92124ceb9b2aa84e5d256f8fe2d4968ecaa93758
+ printf '%s' https://github.com/xxx/xxxx

INFO[2024-01-10 15:55:34] Fetching logs for TaskRun: test-custom-task-run-dgx8d-cat-readme
INFO[2024-01-10 15:55:34] Fetching logs for container 'step-cat-readme-test-custom-task' in Pod 'test-custom-task-run-dgx8d-cat-readme-pod'
INFO[2024-01-10 15:55:34] Logs from container 'step-cat-readme-test-custom-task':
...
Displays the last 10 lines of the README from the user-specified repository.
...
For more information on how to use Kurator pipeline-related CLI commands, you can refer to the provided command help.
$ kurator pipeline execution -h
manage kurator pipeline execution

Usage:
kurator pipeline execution [command]

Available Commands:
list        list the kurator pipeline execution
logs        Display aggregated logs from multiple tasks within kurator pipeline execution

...
Cleanup
To remove the pipeline examples used for testing, execute:
kubectl delete pipelines.pipeline.kurator.dev -n kurator-pipeline test-predefined-task test-custom-task
Please note: When the pipeline of Kurator is deleted, all the resources it created, including the pods of tasks and the services of event listener, will be deleted as well.
Feedback
Was this page helpful?
Glad to hear it! Please tell us how we can improve.
Sorry to hear that. Please tell us how we can improve.