Enable multi cluster Monitoring with fleet
In this tutorial we’ll cover the basics of how to use Fleet to manage metirc plugin on a group of clusters.
Architecture
Fleet’s multi cluster monitoring is built on top Prometheus and Thanos, the overall architecture is shown as below:

Prerequisites
-
Setup Fleet manager by following the instructions in the installation guide.
-
Kurator metric depends on Thanos, Object Storage is required for Thanos. In the task, Minio is used, setup by the installation guide.
-
Running the following command to create two secrets to access attached clusters.
kubectl create secret generic kurator-member1 --from-file=kurator-member1.config=/root/.kube/kurator-member1.config
kubectl create secret generic kurator-member2 --from-file=kurator-member2.config=/root/.kube/kurator-member2.config
Create a fleet with metric plugin enabled
kubectl apply -f examples/fleet/metric/metric-plugin.yaml
After a while, we can see the fleet is ready:
kubectl wait fleet quickstart --for='jsonpath='{.status.phase}'=Ready'
Thanos and Grafana are installed correctly:
kubectl get po
NAME                                    READY   STATUS    RESTARTS   AGE
default-thanos-query-5b6d4dcf89-xm54l   1/1     Running   0          1m
default-thanos-storegateway-0           1/1     Running   0          1m
grafana-7b4bc74fcc-bvwgv                1/1     Running   0          1m
Apply more monitor settings with Fleet Application
Run following command to create a avalanche pod and ServiceMonitor in the fleet:
cat <<EOF | kubectl apply -f -
apiVersion: apps.kurator.dev/v1alpha1
kind: Application
metadata:
  name: metric-demo
  namespace: default
spec:
  source:
    gitRepository:
      interval: 3m0s
      ref:
        branch: main
      timeout: 1m0s
      url: https://github.com/kurator-dev/kurator
  syncPolicies:
    - destination:
        fleet: quickstart
      kustomization:
        interval: 5m0s
        path: ./examples/fleet/metric/monitor-demo
        prune: true
        timeout: 2m0s
EOF
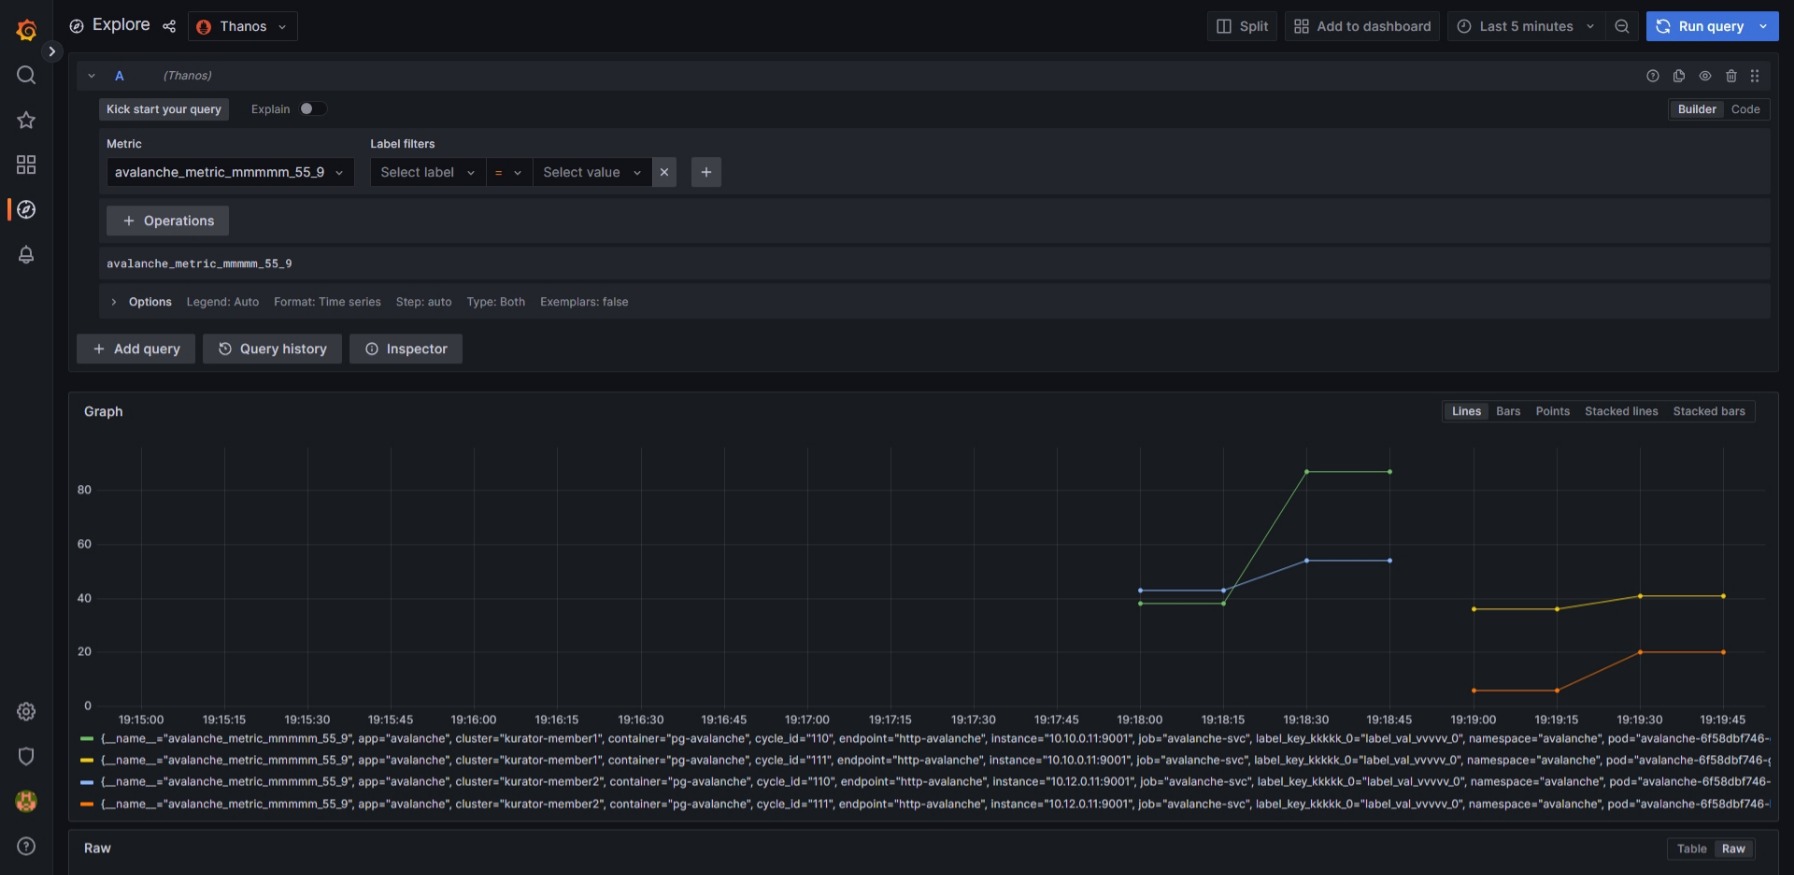
Query metric from Grafana
After a while, you can go to grafana datasource page query avalanche metric, it will looks like following:
Cleanup
Delete the fleet created
kubectl delete application metric-demo
kubectl delete fleet quickstart
Uninstall fleet manager:
helm uninstall kurator-fleet-manager -n kurator-system
IMPORTANT: In order to ensure a proper cleanup of your infrastructure you must always delete the cluster object. Deleting the entire cluster template with kubectl delete -f capi-quickstart.yaml might lead to pending resources to be cleaned up manually.
kubectl delete cluster --all
Uninstall cluster operator:
helm uninstall kurator-cluster-operator -n kurator-system
Optional, clean CRDs:
kubectl delete crd $(kubectl get crds | grep cluster.x-k8s.io | awk '{print $1}')
kubectl delete crd $(kubectl get crds | grep kurator.dev | awk '{print $1}')
Optional, delete namespace:
kubectl delete ns kurator-system
Optional, unintall cert manager:
helm uninstall -n cert-manager cert-manager
Optional, shutdown cluster:
kind delete cluster --name kurator
Feedback
Was this page helpful?
Glad to hear it! Please tell us how we can improve.
Sorry to hear that. Please tell us how we can improve.